VLDB 2026  ·  Demo Paper

DataMagic: Turn
Structured Data into
Narrated Video

About
Upload a table, describe the story, and generate an animated data video with AI planning, template recommendation, editable scenes, and data-grounded rendering.
Live product  ·  VLDB 2026 Demo  ·  Source code in progress

Overview

From raw table to shareable
data story

DataMagic is an interactive system for turning tabular data into narrated, animated, and editable data insight videos. It is designed for analysts, researchers, and teams who need data to become a story rather than a static chart.

The system supports three practical paths: a complete multi-scene pipeline, a faster generation mode for quick reports, and Single Chart for one focused animated visualization. Users can preview results, refine text and visuals, and export real MP4 videos.

Under the hood, DVSpec keeps visual elements tied to source data fields and aligns animation timing with narration, so the result stays traceable, editable, and suitable for data communication.


Workflows

Choose the right generation path

DataMagic supports both complete data-story videos and lightweight chart generation, depending on how much structure and speed the task needs.

Full Pipeline

Narrated multi-scene data videos

  • Upload a CSV or Excel table and describe the analytical goal
  • AI plans scenes, chart choices, narration, and visual pacing
  • Best for business reports, research summaries, and presentations
Fast Generation

Complete video with faster turnaround

  • Keeps AI planning and narration, but uses optimized rendering paths
  • Good for recurring reports, drafts, and quick review cycles
  • Balances speed with a coherent generated story
Single Chart

One focused animated visualization

  • Paste or upload a small table and describe the desired chart
  • AI recommends suitable templates and styles before generation
  • Best for slide decks, quick sharing, and one-off data explanations

Demo Video

System walkthrough

Examples

Generated data stories

Representative outputs across business, energy, and technology datasets. Each example is a real video generated from structured data and a natural-language intent.


Template Gallery

Preview visual styles before generation

DataMagic includes more than 100 ready-made visual styles across bar, line, pie, scatter, Sankey, waterfall, KPI card, and narrative scenes. Template recommendation helps match the data shape and communication goal before rendering begins.

DataMagic template gallery

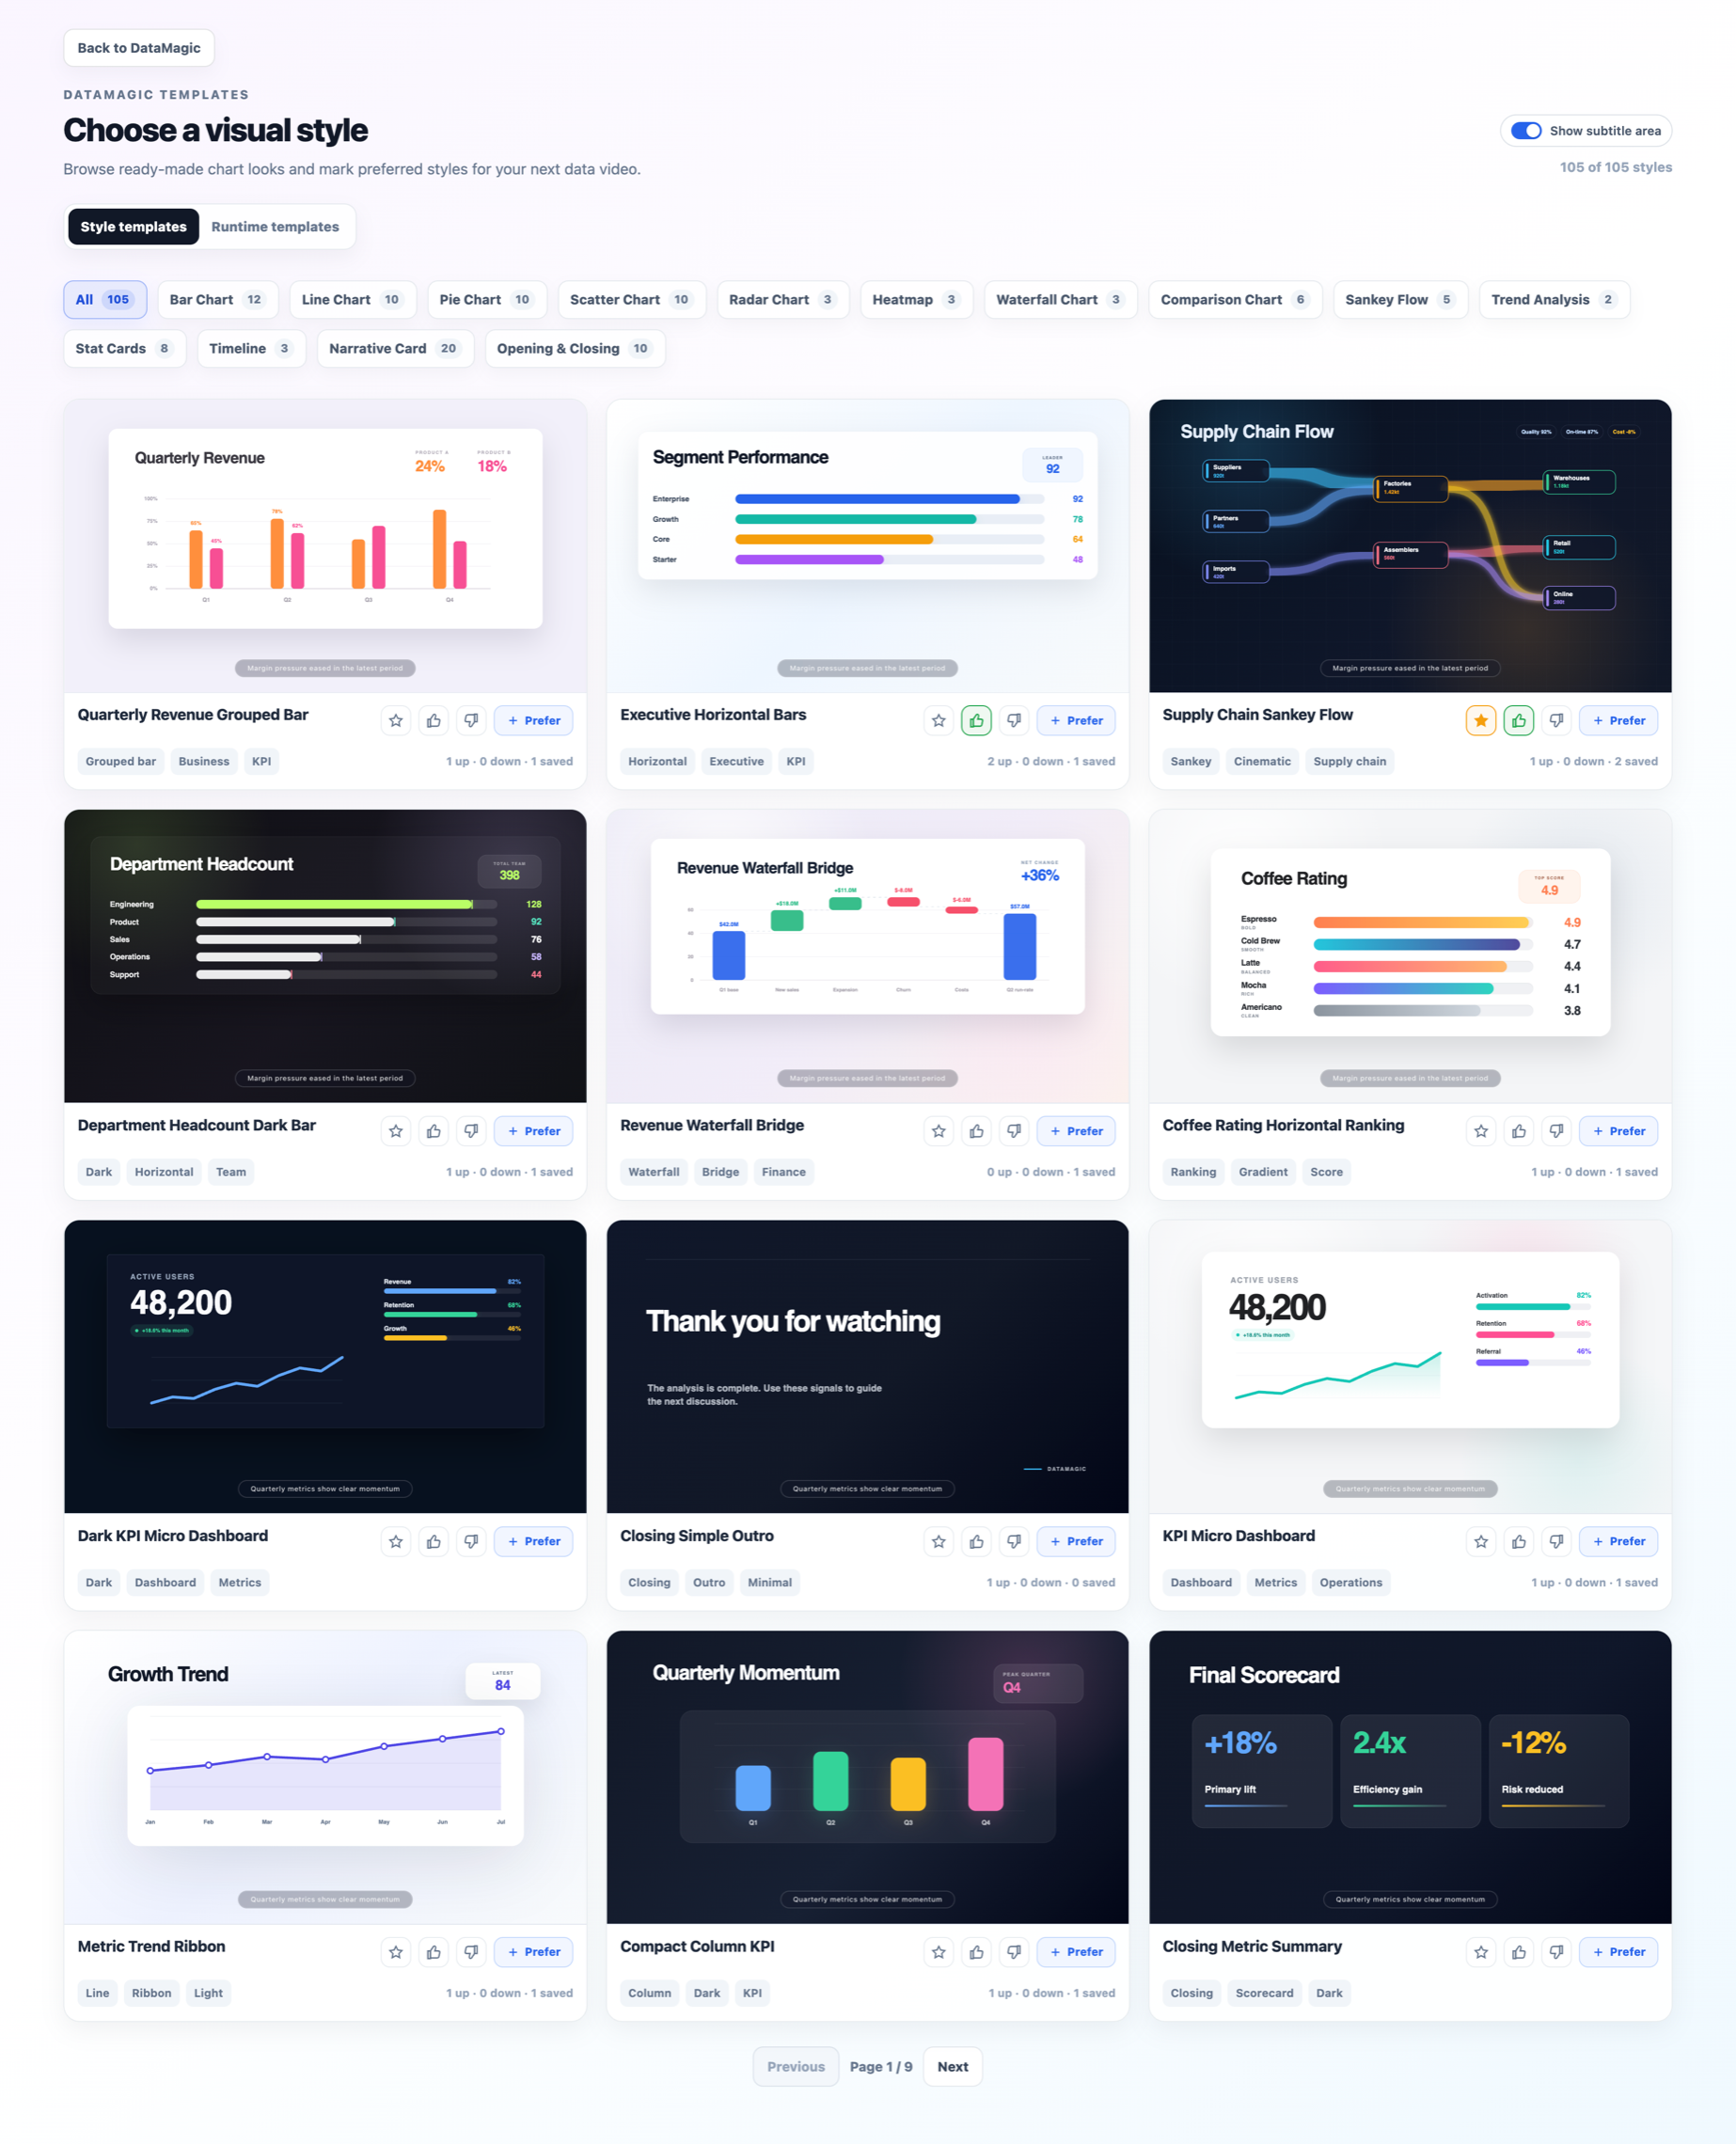
Template Gallery — browse, preview, and mark preferred visual styles before generating a video or Single Chart.


Highlights

What DataMagic brings
to the table

01

Full data-to-video generation

Generate presentation-ready data videos from uploaded tabular data, including scene planning, chart selection, narration, animation, and export.

02

Fast runtime generation

Use optimized generation and rendering paths when speed matters, while still keeping AI-assisted planning and narrative structure.

03

Single Chart mode

Paste or upload data and quickly generate one animated visualization without running the full multi-scene story pipeline.

04

Template recommendation

AI recommends chart types and style templates from the gallery based on the data columns, analytical goal, and desired communication style.

05

Runtime preview and editing

Preview generated videos, edit text directly, refine with natural language, and keep updates local where possible instead of regenerating everything.

06

Data-grounded scenes

Visual elements are bound to underlying data fields through DVSpec, making generated stories easier to inspect, revise, and trust.


Architecture

Generate-then-Orchestrate pipeline

DataMagic processes raw tabular datasets and natural language queries through a two-stage multi-agent engine, producing a DVSpec configuration compiled into a complete narrative video.

CSV + Query Stage 1 — Candidate Gen. DVSpec Stage 2 — Orchestration Narrative Video
DataMagic system architecture diagram

Fig. 1 — Two-stage pipeline from raw tabular data to narrative video, with DVSpec as the structured intermediate representation.

Stage 1

Data-driven candidate generation

  • Story Planner — decomposes query into analytical sub-tasks: trends, comparisons, distributions
  • Data Manager — generates Python code to slice, filter, and aggregate data for each sub-task
  • Visual Designer — designs chart type, data bindings, style; extracts insights into DVSpec content fields
Stage 2

Global narrative orchestration

  • Narration Director — selects scenes by insight value, orders by narrative logic (macro-to-micro)
  • Animation Coordinator — binds data entities in narration to visual elements via semantic references
  • Rendering Engine — compiles DVSpec to video; TTS synthesizes narration into audio

System Interface

Three interactive scenarios

The web interface provides four panels — upload & history (A), real-time video preview (B), scene timeline & narration editor (C), and AI-assisted editing (D) — supporting three complementary interaction modes.

DataMagic web interface

Fig. 2 — System Interface

AData upload & history panel
BReal-time video preview
CScene timeline & narration editor
DAI-assisted editing — canvas manipulation (D1), provenance-based Q&A (D2), scene generation (D3)
Scenario 1

Data-driven automated generation

Upload a business CSV and enter a natural language query — "Analyze Q4 revenue peaks, regional marketing efficiency, and top product profit contributors." Watch the multi-agent engine execute in real time: query decomposition → parallel data slicing → chart design → narrative orchestration.

Unlike black-box generation, the system transparently displays the scene timeline, narration text, animation labels, and underlying data tables — every visual element traceable back to the source CSV.

Scenario 2

DVSpec-based multimodal editing

Refine the generated video through three modes sharing a single DVSpec state — edits are local and incremental, never triggering full regeneration:

  • Canvas direct manipulation — click a chart to open a Property Inspector; switch chart types, modify data mappings, adjust colors. All interactions map in real time to local DVSpec updates.
  • Declarative script editing — edit narration text directly in the timeline editor; when audio duration changes, animation timing re-aligns automatically.
  • Natural language commands — type "@Scene 4: change to treemap and highlight top product." The system parses and triggers incremental re-rendering of that scene only.
Scenario 3

Structured provenance-based data Q&A

DVSpec preserves full semantic provenance, turning one-way videos into explorable data interfaces:

  • Ask scene-level questions — "Which product has the highest Q3-to-Q4 growth rate?" — and receive exact structured answers from the original dataset (4K Monitor: +52.5%; Laptop Pro X: +52.2%).
  • Ask global questions spanning the full video for multi-granularity data exploration.
  • Convert Q&A insights into new scenes — "Add a scene showing monthly revenue trend for the top 2 growth products."

DVSpec

Declarative Data Video Specification

Existing specifications — Vega-Lite, Canis — cover static charts or single-chart animations, but lack unified cross-modal temporal coordination for multi-scene data videos. DVSpec fills this gap: a structured intermediate representation that fully decouples logical description from rendering implementation.

Data-driven semantic references

Visual elements are referenced by data attribute values — e.g., {"product": "4K Monitor"} — not hard-coded identifiers. References stay valid across data updates and chart-type changes, ensuring every pixel traces back to a CSV cell.

Narration-index triggering

Animation triggers are declared with narration segment indices, not absolute timestamps. When users edit narration text and TTS audio duration changes, the system automatically re-aligns all animation timing — no manual keyframe adjustment.

DVSpec structure and rendering flow

Fig. 3 — DVSpec structure (a) and rendering flow (b). Translated by language-specific converters into D3.js visualizations and Remotion animations.

scene.dvspec.json
// Chart scene — semantic references + narration-indexed triggers
{
  "type": "chart",
  "content": {
    "chart_type": "bar",
    "data_bindings": { "x": "product", "y": "growth_rate" }
  },
  "narration": [
    "4K Monitor leads with 52.5% Q3-to-Q4 growth,",   // index 0
    "followed by Laptop Pro X at 52.2%."               // index 1
  ],
  "animation": [
    {
      "type": "highlight",
      "target": { "product": "4K Monitor" },    // semantic ref — not a pixel coord
      "trigger": { "narration_index": 0 }          // auto-aligns to TTS duration
    },
    {
      "type": "highlight",
      "target": { "product": "Laptop Pro X" },
      "trigger": { "narration_index": 1 }
    }
  ]
}

Roadmap

Current status and next steps

DataMagic is live and will be progressively open-sourced with more implementation notes, datasets, and template examples.

Full Pipeline, Fast Generation, and Single Chart

The core generation modes are available for multi-scene videos, faster report generation, and one focused animated chart.

Template gallery and runtime preview

Users can browse visual styles, preview generated videos, edit text, and refine output through natural-language interaction.

More public source code and implementation notes

We are preparing more documentation around the pipeline, DVSpec, template adapters, and deployment workflow.

Stronger template recommendation and feedback learning

Upcoming work focuses on improving style selection, learning from user feedback, and expanding examples and benchmark cases.


Community

Follow updates and join the discussion

The hosted product is open for public use. The source code is being progressively released, and feedback from real data-video use cases is welcome.

Try DataMagic
Live
Use the online product to upload data, generate a narrated video, test Single Chart, and explore the template gallery.

Try It Now

WeChat Community
DataMagic WeChat community QR code
Scan to join the discussion group, share use cases, ask questions, and follow product updates.